
Lake Lanier - Chlorophyll NDCI Timeseries
The Sentienl-2 satellite-derived Normalized Difference Chlorophyll Index (NDCI) provides rough estimates of chlorophyll concentrations over time. The graph is generated using hundreds of satellite observations.
Data provide raw spectral index values. Estimates are provisional and have not been validated for all dates/locations. This preliminary data may help identify spatiotemporal patterns and support future research.
Interactive map by Dr. Amber Ignatius and IESA students Z. Boyd, A. Freeland, C. Jackson, B. Mann, and K. Perry using GEE code.

LAKE LANIER DROUGHT VS. FULL POOL LANDSAT
Lake Lanier reached record low water levels during the 2007-2009 regional drought.
Examine how the Landsat 5 satellite captured exposed shoreline, connected islands, and decreased surface water extent on March 2, 2008. Compare the low water conditions with full-pool conditions on March 17, 2019 using Landsat 8 imagery.
Lake Lanier Buford Dam Water Levels:
March 2, 2008: 1053.40 ft
March 17, 2019: 1073.91 ft
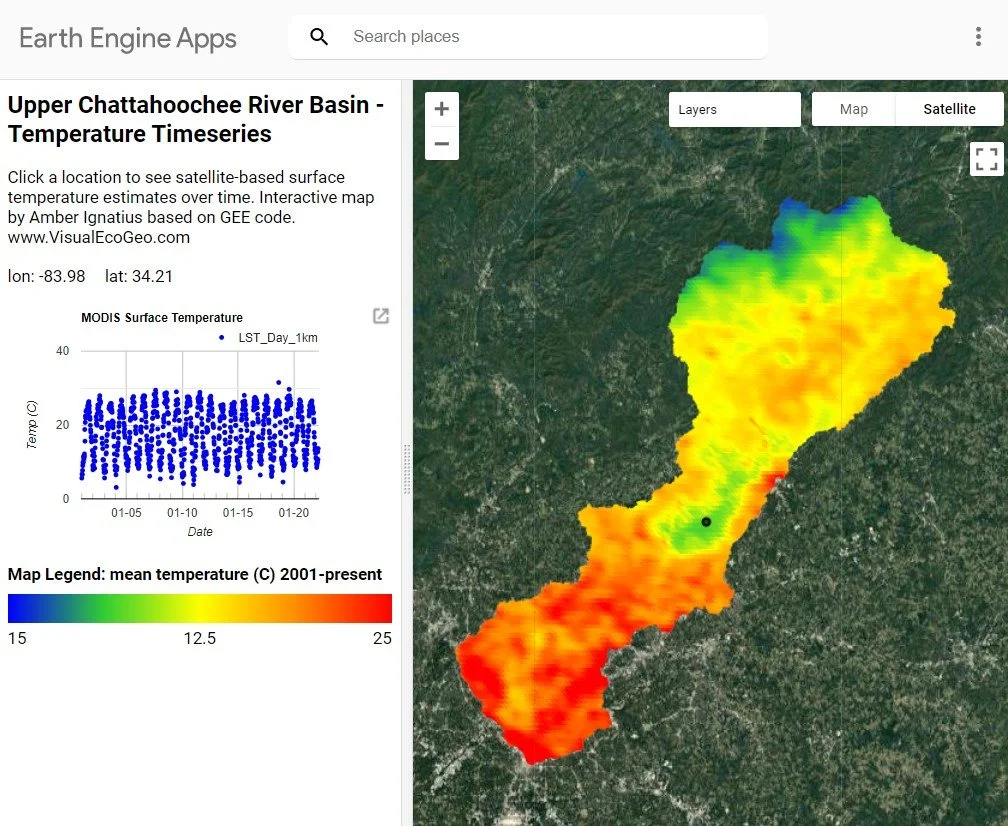
Upper Chattahoochee River Basin - Temperature Timeseries
Click a location to see satellite-based surface temperature estimates over time. Interactive map by Amber Ignatius based on GEE code.

Upper Chattahoochee River Basin - Precipitation Timeseries
Click a location to see CHIRPS precipitation estimates over time. Interactive map by Amber Ignatius based on GEE code.

Stream discharge
The “Chattahoochee River Near Cornelia, GA” water monitoring location collects stream flow data at one site along the Chattahoochee River in Habersham County, GA. The data is available online and includes current conditions of stream discharge, gage height, and regional precipitation.

LAKE LANIER: SENTINEL-2 LINKED MAPS
The European Space Agency launched the first Sentinel-2 satellite mission in 2013. In addition to capturing red, green, and blue colors seen by the human eye, Sentinel-2 sensors record additional wavelengths of electromagnetic energy.
This set of “linked-maps” allows investigation of Lake Lanier and surrounding landscapes using “natural colors” and other portions of the electromagnetic spectrum. Zoom-in to explore how different land features are portrayed…
“Color Infrared” maps identify healthy vegetation (bright red).
“Vegetation” maps differentiate vegetation types using short-wave infrared radiation.
“Land/Water” maps exemplify different reflectance properties of land and water (black).